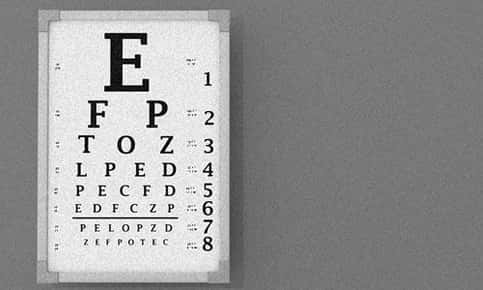
Reading an eye chart mounted or projected on a wall is a standard part of every visit to the optometrist today, but it wasn't always that way. Centuries ago, practitioners struggled to measure visual acuity, the ability to see clearly. As a result, patients were given glasses that didn't adequately correct their vision. Nineteenth-century eye doctors realized that they needed a uniform way to test vision. After a little experimenting, they created eye charts that helped them quickly and accurately assess acuity.
A Man Ahead of His Time
German physician Heinrich Kuechler designed an early eye chart in 1843 that featured one word per line. Although the first word at the top of the chart was large, the typeface size became progressively smaller with each line. Three different versions of the Kuechler chart were used to prevent patients from memorizing the words. Unfortunately, others in the medical field did not share Dr. Kuechler's enthusiasm for the chart, and it was never used extensively.
The Introduction of the Modern Eye Chart
In 1854, Austrian ophthalmologist Eduard Jaeger developed a new chart designed to test acuity after cataract surgery. The chart was eventually also used to diagnose refractive errors, such as myopia (nearsightedness) or hyperopia (farsightedness). His chart didn't display a single word per line like Dr. Kuechler's chart but required patients to read a series of sentences printed in several sizes. Because the size of the letters varied based on the typeface that a particular doctor used, it was difficult to obtain uniform results with the Jaeger chart.
Franciscus Donders was one of the ophthalmologists who became frustrated by the limits of Dr. Jaeger's chart. Dr. Donders was studying accommodation, the eye's ability to change focus between near and far objects, and refraction, the way light rays bend when they pass through the eye. He realized that he needed a chart that would help him accurately measure both near and far vision and asked his colleague Herman Snellen to create a new eye chart in 1862.
Dr. Snellen's first attempt at chart design involved an array of shapes that he asked patients to describe. Unfortunately, everyone described the shapes a little differently, which affected the accuracy of the test. Snellen decided to use capital letters instead and created his very own characters, which were known as optotypes.
Optotypes were proportional and designed to be easily reproducible no matter where in the world the chart was used. The letters at the top of the chart were very large but gradually decreased in size. Patients stood 20 feet away from the chart and tried to read each of the 11 lines from top to bottom. Although Snellen's chart is still in use today, mirrors are often used to allow patients to read the chart from distances less than 20 feet.
Snellen also designed a special chart for young children or people who couldn't read. The chart uses a capital "E" turned in various directions and printed in decreasing sizes. During the eye test, patients are asked to describe which way the arms of the E are pointing.
Throughout the years, a few tweaks have been made to the Snellen chart. In 1868, Dr. John Green refined the grid, introduced proportional spacing and ensured that each line was 25 percent smaller than the one preceding it.
In addition to the Snellen eye chart, you may also read the Bailey-Lovey Chart during your visit to the eye doctor. The chart, which was created in 1976 to evaluate near vision, uses five letters per line and organizes the lines in a triangular shape. The chart features a logarithmic size progression to ensure that the only difference from line to line is the size of the optotypes.
How the Snellen Eye Chart Works
The Snellen eye chart helps optometrists identify a numerical representation of your visual acuity. For example, if you have 20/60 vision, the line that you can see clearly at 20 feet can be seen by someone with normal vision at 60 feet. If your vision is normal, you have 20/20 vision. Although reading the Snellen eye chart is the first step in determining your eyeglass or contact lens prescription, you'll also need a few other tests to fine-tune your prescription.
Has it been a while since you've seen a Snellen eye chart? Give us a call to schedule an eye exam.
Sources:
American Academy of Ophthalmology: All About the Eye Chart, 11/30/16
https://www.aao.org/eye-health/tips-prevention/eye-chart-facts-history
New York Times: Who Made That Eye Chart?, 5/24/13
http://www.nytimes.com/2013/05/26/magazine/who-made-that-eye-chart.html
Gizmodo: Examining the Fascinating Typographic History of Eye Charts, 9/24/15
https://gizmodo.com/examining-the-typographic-history-of-eye-charts-1732823179
Medline Plus: Visual Acuity Test, 2/7/17